On this page
If your basal body temperature (BBT) has stepped up again after ovulation, it is understandable to wonder whether the chart is finally showing pregnancy. The pattern can feel hopeful, but it is not a pregnancy result.
A triphasic BBT chart has three apparent temperature levels: lower readings before ovulation, a sustained rise after likely ovulation and a later second sustained rise. It can appear in pregnant and non-pregnant cycles, so it cannot confirm implantation or pregnancy.
First check whether the later readings form a genuine cluster and whether sleep, illness, alcohol, waking time or a changed measurement routine could explain them. If your period is due or late, a correctly timed hCG pregnancy test gives a more direct answer than another morning temperature.
Quick answers about triphasic BBT charts
Does a triphasic BBT chart mean you are pregnant?
No. A triphasic BBT chart can occur in pregnant and non-pregnant cycles. It describes a second sustained luteal temperature rise; it does not confirm implantation, hCG or pregnancy.
When does a triphasic shift usually occur?
The app-based convention is usually around 7 to 10 days past ovulation (DPO), but no medically validated day or temperature increase proves implantation or pregnancy. If ovulation was estimated incorrectly, the apparent DPO of the rise moves too.
What should you do if your chart looks triphasic?
Check disturbed readings and the date your period is due. When testing is appropriate, use an hCG pregnancy test and follow its instructions rather than asking the chart to diagnose pregnancy.
What does a triphasic BBT chart look like?
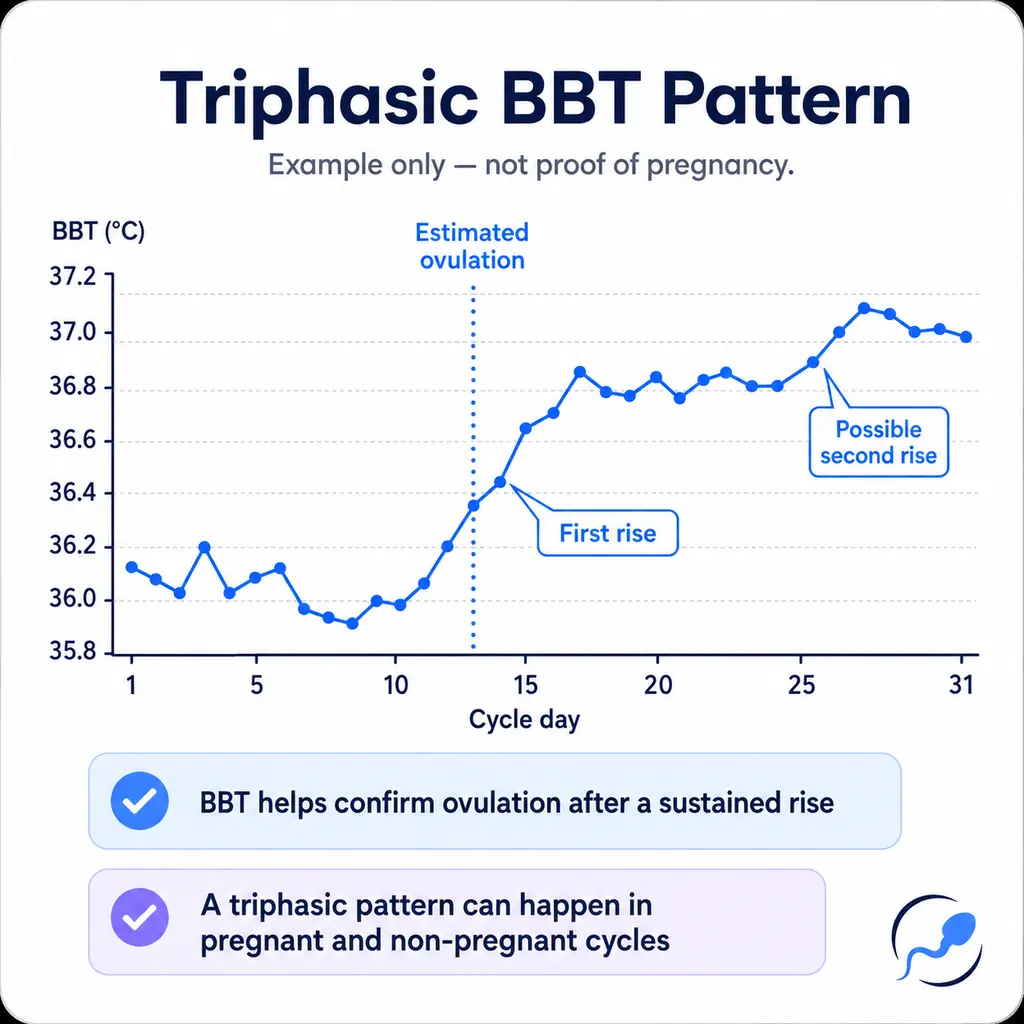
Australian fertility-awareness guidance describes a typical post-ovulation BBT rise of about 0.2 to 0.5°C. The important feature is the sustained change from your own earlier readings, not reaching one universal Celsius value.
A usual ovulatory chart is described as biphasic because it has two broad levels: generally lower temperatures before ovulation and generally higher temperatures afterwards. A triphasic chart adds a later cluster that sits above the first post-ovulation level.
The word triphasic describes the graph’s shape. It is not a diagnosis, and different apps or charting rules may classify the same readings differently. If you are also checking the first post-ovulation shift, BBT charting is most useful when the thermometer, measurement site and waking routine stay reasonably consistent.
Before ovulation, the lower readings form your personal baseline for that cycle. After likely ovulation, several higher readings can form the first sustained shift as progesterone rises.
A possible third phase is a later cluster that sits above the first luteal level. One isolated high temperature is still a spike, not a new phase.
When does a triphasic shift occur, and what do the pregnancy statistics mean?
Fertility Friend’s charting convention places the beginning of a possible third phase at least seven days after ovulation. In its informal app-database analysis, the average onset was about 9 DPO. This is where the commonly quoted 7-to-10-DPO timing comes from.
That timing is an app convention, not a medically validated implantation window or pregnancy threshold. If an app places ovulation one or two days differently from when it occurred, the apparent DPO of the second rise moves as well. When the ovulation date is uncertain, calculating the luteal phase from the best-supported ovulation day shows why DPO labels can shift.
The same informal analysis reported its triphasic pattern in 12.46% of pregnancy-labelled charts and 4.47% of non-pregnancy charts, making the pattern about 2.79 times as frequent in the pregnancy-labelled group.
This does not mean that a person with a triphasic chart has 2.79 times the personal chance of pregnancy. The analysis compared how often a pattern appeared in two app groups; it did not establish a clinically validated sensitivity, specificity or individual pregnancy probability.
| Reported result | What it supports | What it does not support |
|---|---|---|
| 12.46% of pregnancy-labelled charts | The pattern appeared in a minority of charts in that group. | That pregnancy should produce a triphasic chart. |
| 4.47% of non-pregnancy charts | The same pattern also appeared without pregnancy. | That a third rise is specific to pregnancy. |
| About 2.79 times as frequent | A relative difference between the two database groups. | Your personal probability of pregnancy from the chart alone. |
Can a third rise show implantation or rising hCG?
No. BBT records temperature; it does not detect an embryo attaching to the uterus, measure progesterone in blood or detect human chorionic gonadotrophin (hCG).
A triphasic rise is different from a one-day implantation dip on a BBT chart. The rise refers to a later higher cluster, while the dip refers to a one-day fall. Both are retrospective chart descriptions, and neither confirms implantation.
Why can a second BBT rise happen when you are not pregnant?
Progesterone has a thermogenic effect and helps keep temperature higher after ovulation. Luteal hormone patterns are not perfectly flat, so normal biological variation can create another step up without pregnancy. Research comparing BBT with progesterone metabolites also shows that the two measures do not move in exact lockstep through every cycle.
Measurement conditions can create the same appearance. Illness, more or less sleep than usual, alcohol, stress, a later waking time, shift work, travel, changing thermometers or switching measurement sites can make nearby readings less comparable.
An app can add another layer of apparent certainty by moving a coverline or changing its ovulation estimate as more data arrive. Keep the original temperatures and disturbance notes rather than deleting only the readings that weaken the pattern.
How can you check whether the third rise is real?
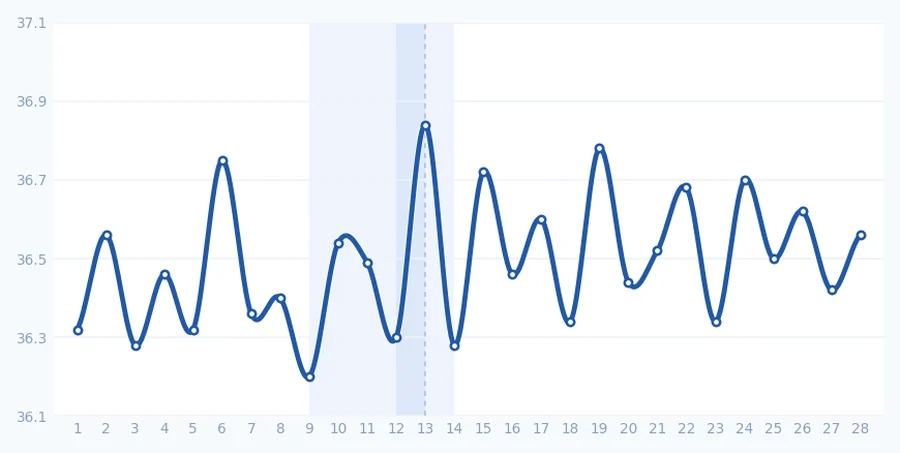
Read the chart in a fixed order. This reduces the chance of deciding “pregnant” first and then moving the coverline, excluding readings or changing the ovulation date to make the graph fit.
Start with the measurement routine. Compare readings taken with the same thermometer and measurement site, and note whether waking time, sleep or illness made a reading less comparable.
Then identify the first sustained shift rather than one spike. Keep disturbed readings visible with a note for alcohol, travel, stress, illness or unusual sleep instead of deleting values because they do not fit the pattern.
For the possible third phase, look for a later cluster above the first luteal level. If your period is due, the next useful decision is pregnancy testing; if symptoms are concerning or the cycle remains difficult to interpret, clinical review is more useful than adjusting the chart.
Pregnant vs not pregnant BBT chart: what can you actually compare?
Pregnant and non-pregnant BBT charts overlap substantially. Both can look biphasic, triphasic, noisy or unusually smooth. Absolute temperature ranges are poor comparison tools because baseline temperature, thermometer, measurement site and routine differ between people.
| What you notice | Pregnancy cycle | Non-pregnancy cycle | Best interpretation |
|---|---|---|---|
| Sustained rise after ovulation | Commonly present. | Commonly present. | Supports a post-ovulation thermal shift, not pregnancy. |
| Later second rise | Can occur. | Can also occur. | A triphasic appearance is not diagnostic. |
| Temperatures still high before the expected period | May remain elevated. | May stay elevated until shortly before bleeding begins. | Your expected period and usual luteal length matter more than one value. |
| Temperatures remain high beyond the usual luteal phase | Can prompt pregnancy testing. | An incorrect ovulation date or cycle variation can still explain the chart. | Use an hCG test rather than a temperature-duration rule. |
| One-day fall | Can occur. | Can occur. | A single fall cannot diagnose implantation, pregnancy loss or an approaching period. |
Compare the current chart with your own well-recorded cycles, but use the comparison to decide when to test rather than to predict the result.
How does BBT fit with ovulation tests and cervical mucus?
BBT is mainly retrospective: the sustained rise becomes clear after likely ovulation. If you need a prospective signal before the temperature shift, ovulation tests detect a rise in urinary luteinising hormone (LH). A positive result narrows the likely window but does not confirm the exact time of egg release or guarantee that ovulation followed.
Cervical mucus answers another timing question. Clearer, wetter and more slippery mucus can appear as fertility increases, while BBT provides later context. Because fertile cervical mucus can appear without confirmed ovulation, it works best as one part of the timing picture rather than a stand-alone result.
LH and mucus help with timing before ovulation, BBT adds retrospective context, and an hCG test answers the pregnancy question.

When is a pregnancy test more useful than the chart?
Once your period is due, a home pregnancy test generally gives a more direct answer than continued BBT interpretation because it detects hCG. Testing earlier can produce a negative result because hCG may still be below the device’s detection threshold, particularly when the ovulation date is uncertain.
If the ovulation day or expected period is uncertain, the Pregnancy Test Timing Calculator can help choose a practical date. Testing before the expected period also increases the chance of a false-negative pregnancy test, especially when ovulation was later than expected. When the timing is appropriate, pregnancy tests can be compared by strip and midstream format before you follow the instructions for the exact device.
If an early test is negative and your period has not arrived, repeat it as directed. Do not use BBT to overrule a correctly performed result; interpret an early negative according to when it was taken and the test’s repeat instructions.
How do progesterone and an hCG trigger change the chart?
Progesterone support can keep temperatures elevated and alter the chart’s luteal shape. A chart cannot show whether the prescribed dose is correct or whether treatment resulted in pregnancy. Do not stop prescribed progesterone because BBT rises, falls or looks triphasic.
An hCG trigger creates a separate testing issue. Current Australian Ovidrel information states that choriogonadotropin alfa can interfere with serum or urine hCG testing for up to ten days and may cause a false-positive pregnancy test. Follow the fertility clinic’s nominated test date.
If you used Ovidrel or another hCG trigger, medicine timing and the clinic’s nominated test date take priority over a home temperature chart.
When should you show your BBT chart to a GP in Australia?
Bring the raw temperatures, cycle dates, measurement times and disturbance notes rather than only an app-generated label. A GP can interpret the chart alongside menstrual history, symptoms and the reason ovulation or fertility needs assessment.
Book an appointment if periods are absent or repeatedly irregular, bleeding is unusual, pelvic pain is persistent, or several well-recorded cycles remain difficult to interpret. One noisy, biphasic or triphasic chart is not itself a diagnosis.
Pregnancy, Birth and Baby advises seeing your doctor after 12 months of trying if you are under 35, or after six months if you are 35 or older. Pregnancy, Birth and Baby also advises considering earlier review when age or another fertility concern makes waiting less appropriate. At that point, fertility specialist assessment in Australia may follow GP review and first-line investigation.
If pregnancy is possible and you develop strong or one-sided abdominal or pelvic pain, shoulder-tip pain, heavy bleeding, marked dizziness, fainting or collapse, seek urgent medical assessment. Call triple zero on 000 for a life-threatening emergency.

Frequently Asked Questions about Triphasic BBT Charts in Australia
Can you be pregnant without a triphasic BBT chart?
Yes. Most pregnancy-labelled charts in the informal Fertility Friend analysis were not triphasic. A biphasic, noisy or otherwise ordinary-looking chart does not rule pregnancy out.
How many high temperatures make a triphasic chart?
There is no universal medically validated number. The label usually refers to a sustained group of readings above the first luteal level, while one high temperature remains a spike.
Does a triphasic chart mean progesterone is high?
No. Progesterone contributes to the post-ovulation temperature rise, but BBT cannot measure a progesterone concentration or show that a level is adequate. A clinician may use appropriately timed blood testing when that question matters.
Why did my temperature rise and then fall again?
A fall can reflect normal variation, sleep or measurement differences, illness, an approaching period or another disturbance. One change cannot confirm pregnancy loss or treatment failure.
What if BBT stays high but pregnancy tests are negative?
The ovulation date may be wrong, testing may be early, or temperature may remain elevated for another reason. Repeat as directed and see a GP if your period remains absent.
Is a biphasic chart less fertile than a triphasic chart?
No. A clear biphasic pattern can be compatible with ovulation. A third phase is not required for conception and does not make a cycle more fertile.
Next Steps in Australia
Keep the next decision small. Preserve the raw readings and mark disturbed temperatures so you can judge whether the later values form a sustained cluster without changing the chart to fit the result you hope for.
If your period is due or late, use a pregnancy test according to its instructions. If it is still early, choose one sensible repeat date rather than using extra temperature readings as a pregnancy test.
For a future cycle, use BBT to review what happened after ovulation and a prospective sign such as urinary LH or cervical mucus to plan before the rise. If cycles remain unclear, symptoms concern you or the recommended time trying has passed, take the record to your GP.
✓ Medically reviewed by Evan Kurzyp, RNLast reviewed Next review September 2027
References12 sources
Fertility2Family articles are researched using Australian Government health guidance, professional clinical recommendations and peer-reviewed medical literature. The references below were used to research and medically review this article and provide additional reading for readers who want to explore the evidence in more detail.
You can read how we research, write and check our health information in our editorial and medical review policy, and see who reviews our articles and their clinical credentials.
- Healthdirect Australia. Fertility awareness (natural family planning)
Australian guidance on post-ovulation temperature change, consistent waking measurements and common disturbances, including illness, altered sleep, alcohol and stress, that can reduce BBT reliability. - Pregnancy, Birth and Baby. Ovulation and fertility
Australian guidance on ovulation, fertile-window timing, urinary LH testing, basal-temperature changes and when people trying to conceive should seek medical advice. - Fertility Friend. Triphasic Pattern and Pregnancy
Original app-database analysis defining its triphasic rule and reporting pregnancy-labelled versus non-pregnancy chart frequencies. Useful for context but not peer-reviewed medical evidence. - Bioengineering & Translational Medicine. Detection of ovulation, a review of currently available methods
Peer-reviewed review comparing BBT, urinary LH, progesterone measurements and ultrasound, including the retrospective role and practical limitations of temperature-based ovulation detection. - Steroids. Descriptive analysis of the relationship between progesterone and basal body temperature across the menstrual cycle
Observational study comparing daily BBT with progesterone metabolites and ultrasound-defined ovulation, showing a moderate relationship while demonstrating that temperature and progesterone patterns do not always align. - European Journal of Obstetrics & Gynecology and Reproductive Biology. Detecting evidence of luteal activity by least-squares quantitative basal temperature analysis against urinary progesterone metabolites and the effect of wake-time variability
Study comparing quantitative BBT analysis with urinary progesterone metabolites and examining how variation in waking time can affect temperature-based evidence of luteal activity. - Healthdirect Australia. hCG test
Australian guidance explaining urine and blood hCG testing, detection around a missed period, early false-negative results, repeat testing and interpretation with clinical context. - Royal College of Pathologists of Australasia. Progesterone
Current Australasian pathology guidance on progesterone testing across the menstrual cycle, including its use when investigating ovulation and infertility and the need for cycle-stage interpretation. - Australian Commission on Safety and Quality in Health Care. Ovidrel Pen
Current Australian medicine information for choriogonadotropin alfa, including fertility-treatment use and its potential to interfere with serum or urine hCG testing for up to ten days. - Healthdirect Australia. Planning for your pregnancy
Australian preconception guidance on fertile timing, the usual time taken to conceive and age-based thresholds for seeking medical advice about possible fertility problems. - Healthdirect Australia. Irregular periods
Australian guidance on menstrual-cycle variation, absent or irregular periods, associated symptoms, possible causes and circumstances in which a GP assessment is recommended. - Pregnancy, Birth and Baby. Ectopic pregnancy
Australian guidance on ectopic pregnancy symptoms and urgent assessment, including one-sided abdominal pain, shoulder-tip pain, bleeding, dizziness, fainting and collapse.