
Trying to conceive can make every chart change feel important. If you track basal body temperature, or BBT, you may notice a one day temperature drop around the middle of the luteal phase and wonder whether it means implantation has happened. This is often called an implantation dip. It can appear in charts from pregnant cycles, but it can also happen in cycles where pregnancy does not occur. Temperature can shift because of sleep, timing, illness, alcohol, stress, room temperature, or normal hormone variation. This guide explains what an implantation dip is, how BBT works, how to interpret a one day dip, when to test for pregnancy, and when to speak with a GP or fertility specialist in Australia.
Quick Answers About Implantation Dips and BBT
What is an implantation dip on a BBT chart
It is a one day drop in basal body temperature about a week after ovulation. It appears after your post ovulation rise and returns to the higher range the next day. It can occur in cycles with or without pregnancy.
How accurate is an implantation dip for predicting pregnancy
It is not a reliable sign on its own. Temperature can fall slightly for many reasons such as timing of measurement, sleep changes, alcohol, travel, or mild illness. Pregnancy is best confirmed with a urine or blood hCG test.
When does implantation usually happen if conception occurs
Implantation often happens about 6 to 10 days after ovulation, sometimes a little earlier or later. A home pregnancy test may remain negative until after your expected period, even if implantation has occurred.
What Is an Implantation Dip and How BBT Works
Basal body temperature is your resting temperature measured first thing in the morning before getting out of bed. It tracks hormone shifts across the cycle. Oestrogen keeps temperatures lower before ovulation, while progesterone from the corpus luteum raises temperatures after ovulation. The post ovulation rise is usually small, often about 0.3 to 0.6 degrees Celsius, and stays higher until your next period.
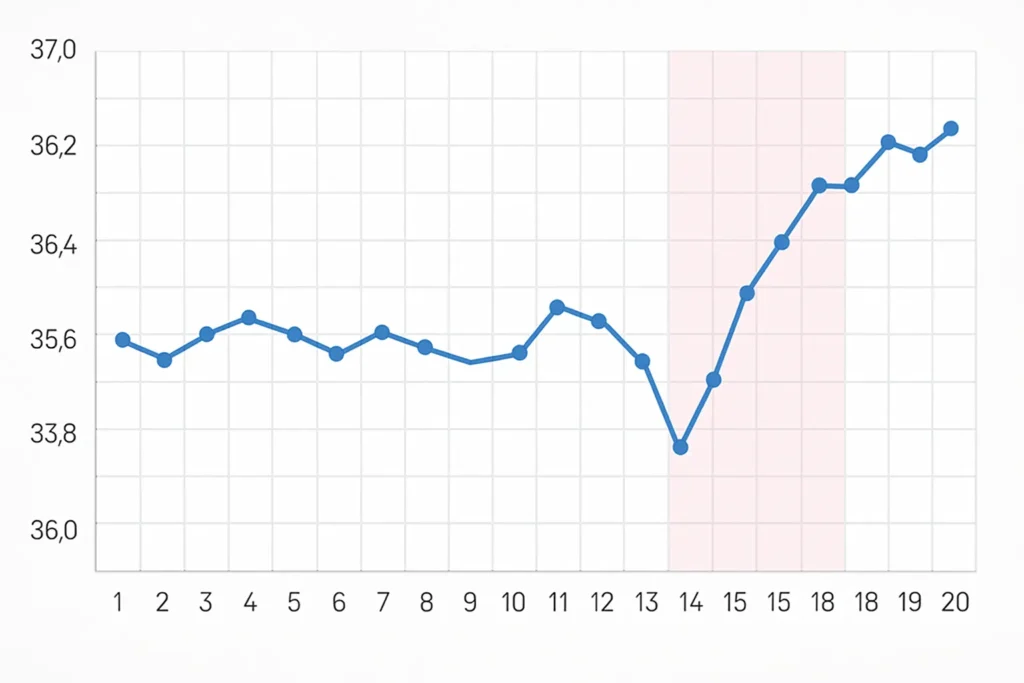
An implantation dip is a brief, one day temperature drop that appears after this rise, most often around the middle of the luteal phase. Some people notice it about a week after ovulation. It should be seen in the context of a clear post ovulatory shift and a steady higher range in the days around it. A single dip does not prove pregnancy. BBT confirms ovulation only after it has happened and is best used alongside cervical mucus, timing records, and ovulation tests.
What Causes Temperature Dips Around the Luteal Phase
The most common reason for a mid luteal dip is normal day to day variability. Even with careful technique, readings can drift because of small changes in wake time, mouth breathing, poor sleep, a different room temperature, or taking the reading after moving. Alcohol, mild illness, travel, and some medicines can also nudge temperatures.
Researchers have explored whether a dip links to implantation. The theory is that brief hormone shifts and increased blood flow in the uterus could lower temperature for a day. In practice, both pregnant and non pregnant cycles can show a dip. A helpful benchmark is that small wobbles are routine, while a larger one day drop may be worth noting only when it fits a wider pattern. If you are also watching for spotting, this guide to implantation bleeding explains why bleeding patterns also need careful interpretation.

How Implantation Dips Are Interpreted in the Real World
Accurate interpretation starts with a clear ovulation pattern. In many charts, the follicular phase sits in a lower temperature range. After ovulation, temperatures rise and cluster in a higher range for at least three days. A one day drop that returns to the higher range the next morning can appear in some cycles with pregnancy, but it is not a standalone sign.
Focus on the whole chart across multiple cycles rather than one reading. If your method is consistent and you see a repeat luteal phase pattern that aligns with intercourse timing, ovulation test results, and luteal length, the information becomes more useful. If you track cervical mucus and ovulation predictor kits with BBT, you can confirm the fertile window and post ovulation timing more clearly. This is especially useful if your ovulation date shifts, because a late or early ovulation can change when a pregnancy test is likely to become positive.
What Tests Involve and How They Fit Into Australian Care
BBT charting requires a reliable basal thermometer that reads to two decimal places. Take your temperature at the same time every morning before getting up. Note factors that may affect readings such as fever, alcohol, restless sleep, travel, or a later alarm. Add cervical mucus observations to help confirm the fertile window. Ovulation predictor kits detect the luteinising hormone surge that usually happens before ovulation.
Pregnancy is confirmed by measuring human chorionic gonadotropin, known as hCG. Home pregnancy tests check hCG in urine. If you prefer a blood test, your GP can arrange serum hCG through a local pathology lab. In early pregnancy your GP may also order repeat blood tests to track the change in hCG and check progesterone where clinically needed. Ultrasound is usually timed from around six to seven weeks from the last period to assess early pregnancy development. This timeline matches common practice in general practice and obstetric care across Australia.
Home Tracking: Thermometers, Coverlines, and Charting Tips
Pick a digital basal body thermometer with 0.01 degree Celsius resolution. Keep it by the bed and measure before sitting up or speaking. Place the reading in a chart or app that allows you to add notes about sleep, illness, alcohol, or medicines. Record at the same time each day where possible. Aim to take enough readings across several cycles so you can see your usual range in both phases.
A coverline is a guide that separates lower pre ovulation readings from higher post ovulation readings on your chart. You can draw it just above the cluster of temperatures in the days before your rise. This baseline makes it easier to notice a sustained shift and to see any one day dip later in the luteal phase. Do not rely on BBT alone for contraception or to time intercourse. Combine it with mucus patterns and ovulation testing for a clearer picture. If you are testing daily across the fertile window, ovulation test strips can support repeated LH testing when used exactly as directed.

When to See a GP or Specialist in Australia
See your GP if you have been trying to conceive for 12 months if you are under 35, or for six months if you are 35 or older. Seek care earlier if your cycles are very irregular, if you have a known condition such as polycystic ovary syndrome or endometriosis, or if you have severe pelvic pain. Your GP can arrange baseline tests such as day two or day three hormones, mid luteal progesterone to confirm ovulation, thyroid function, prolactin, and iron studies. They may also organise a pelvic ultrasound to assess the uterus and ovaries.
If male factor fertility is possible, a semen analysis can be arranged. Depending on results, your GP may refer you to a gynaecologist or a fertility specialist. If you have positive pregnancy tests with pain or bleeding, seek urgent assessment to rule out ectopic pregnancy. Public hospitals and private clinics across Australia can support these pathways.
Where Ovulation and Pregnancy Tests Fit With BBT
BBT shows you that ovulation has already occurred. Ovulation predictor kits fill the timing gap by detecting the surge of luteinising hormone that usually precedes ovulation by one to two days. Together with cervical mucus changes, this helps you time intercourse before ovulation, when conception is most likely. If you are unsure how timing works, this guide to the fertile window explains why the days before ovulation matter.
Pregnancy tests detect hCG after implantation. If you see a one day dip on your chart, wait at least until the day your period is due before testing. Testing too early can give a negative result even if pregnant. If the home test is negative and your period is late, repeat the test in 48 hours or ask your GP for a blood test. If you prefer strips for repeated morning testing, pregnancy test strips can support repeat testing when used according to the instructions. Always read the pack instructions and check expiry dates.
How hCG and DPO Timing Affect Test Results
A BBT dip often appears around 7 to 10 DPO, which is also when many people start thinking about early pregnancy testing. This timing can create confusion because hCG may still be too low for a urine test. A negative result after a dip does not rule out pregnancy. Testing closer to the missed period gives a clearer answer. If you are comparing symptoms and test timing, this 10 DPO symptoms and testing guide explains why some people still test negative even when pregnancy is possible.
If your test shows a very faint line, repeat it in 48 hours with first morning urine and the same test type where possible. A line that appears after the recommended reading window should not be used to confirm pregnancy. This guide to faint lines on pregnancy tests explains how timing, evaporation lines, and early hCG can affect interpretation.
Frequently Asked Questions About Implantation Dips Australia
Can I have an implantation dip and not be pregnant
Yes. Many non pregnant cycles show a one day dip after ovulation. Temperature varies for everyday reasons, so a dip does not confirm pregnancy. Use a home pregnancy test after your missed period for a clearer answer.
Is a larger drop more likely to mean implantation
A bigger change can catch your eye, but size alone does not prove anything. Treat a noticeable one day dip as a prompt to watch the wider pattern. Confirm with hCG testing rather than relying on one reading.
Do I need a special thermometer to track BBT
A digital basal thermometer that reads to 0.01 degrees Celsius is best. This level of detail helps you see the small shift after ovulation and any brief dip. Keep your method consistent and take readings at the same time each day.
When should I start testing for pregnancy after a dip
Most people get a more reliable result from the day the period is due. Testing earlier can show a negative even if implantation has happened. If negative and your period does not arrive, retest in 48 hours or ask your GP for a blood test.
Will a cold, flu, or poor sleep affect my BBT chart
Yes. Illness, restless nights, alcohol, travel, and later wake times can push readings up or down. Make notes on your chart so you can allow for these factors when you review the pattern across the cycle.
Is BBT safe to use for birth control
BBT confirms ovulation after the event, so it is not suitable on its own as contraception. If you want fertility awareness for contraception, speak with a trained clinician and use a combined method that includes mucus tracking and cycle rules.
Final Thoughts and Next Steps
Implantation dips can tempt you to read a lot into a single data point. It helps to step back and view the whole chart. A genuine post ovulation rise, a steady higher range, and a one day dip that bounces back the next morning can appear in both pregnant and non pregnant cycles. Use BBT for what it does well, which is confirming that ovulation has occurred. Pair it with ovulation predictor kits and mucus changes to time intercourse in the fertile window.
Use a reliable home pregnancy test from the day your period is due, then confirm with your GP if you need further support. If you would like one set of tools for cycle tracking and later pregnancy testing, fertility kits can combine ovulation and pregnancy testing in a structured way. If your cycles are irregular, you are not sure you are ovulating, or you have been trying for a while, book a chat with your GP for guidance that fits Australian care pathways.
Last reviewed: May 2, 2026
Next scheduled review: Mar 2027
References
Fertility2Family publishes Australia-focused fertility education. Articles are written by our team and medically reviewed by Australian-registered health practitioners. We use Australian consumer medicine information, Australian clinical and public health guidance, and peer-reviewed research consistent with Australian care. We explain what the evidence suggests, what it cannot confirm, and when to see a GP or fertility specialist. Each article lists its author, medical reviewer, and review dates.
https://www.healthdirect.gov.au/fertility-awareness
https://www.healthdirect.gov.au/ovulation
https://www.healthdirect.gov.au/pregnancy-tests
https://www.betterhealth.vic.gov.au/health/conditionsandtreatments/ovulation
https://www.ranzcog.edu.au/womens-health/fact-sheets/pre-pregnancy-counselling
https://www.jeanhailes.org.au/health-a-z/periods/menstrual-cycle
https://www.fpnsw.org.au/health-information/contraception/fertility-awareness-methods
https://www.qld.gov.au/health/conditions/sexual-health/pregnancy/before-you-get-pregnant