
Has my temperature shifted after ovulation?
A sustained rise of about 0.2°C above the previous six days, held for three days, is the usual sign ovulation has passed. Afterwards, BBT suggests ovulation has likely happened; it cannot predict it.
BBT Chart Annotator
Your chart review
Pattern result
Next:
The chart connects comparable included readings. Excluded readings remain visible as separate grey points.
How the automatic check works
The tool needs nine consecutive cycle days. It calculates the median of six included baseline readings and checks whether the next three included readings are each at least 0.20°C higher. A missing or excluded day breaks that automatic sequence.
This is a transparent Fertility2Family software rule for organising a chart. It is not a validated diagnostic or contraception algorithm.
Use the chart for the next useful decision
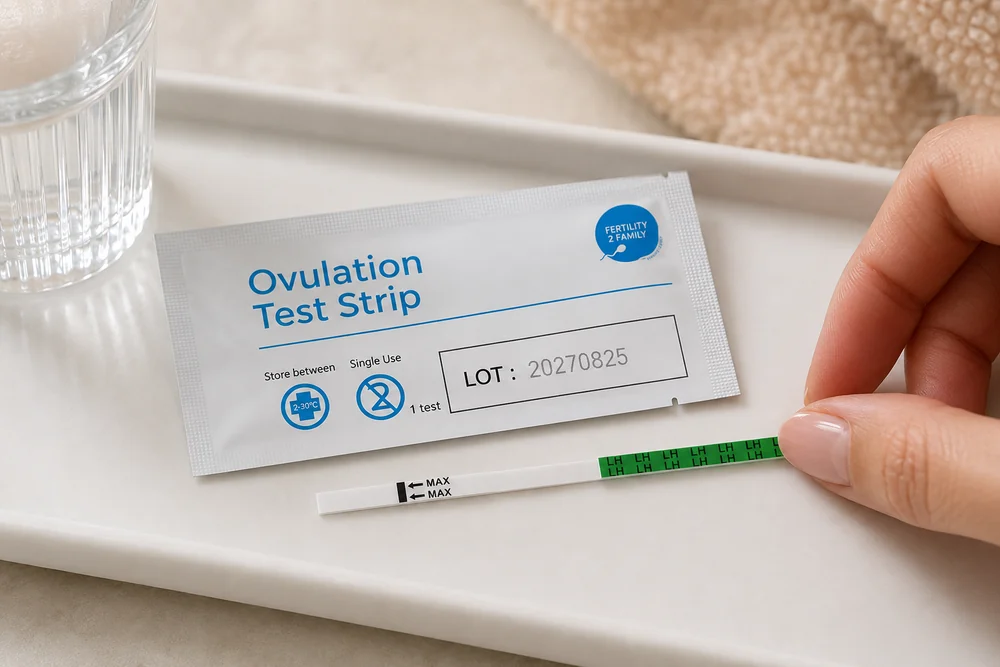
A basal thermometer supports repeatable two-decimal waking-temperature tracking. BBT is retrospective, so use LH tests for fertile-window timing and pregnancy tests for hCG testing.
Use this annotator to review whether your temperature pattern suggests ovulation has likely happened.
Everything behind the result
 How this tool worksWhy BBT suggests ovulation has likely happened but cannot predict it
How this tool works
Why BBT suggests ovulation has likely happened but cannot predict it
Progesterone after ovulation lifts resting temperature by about 0.2 to 0.5°C. A sustained rise, not a single reading, is the signal.
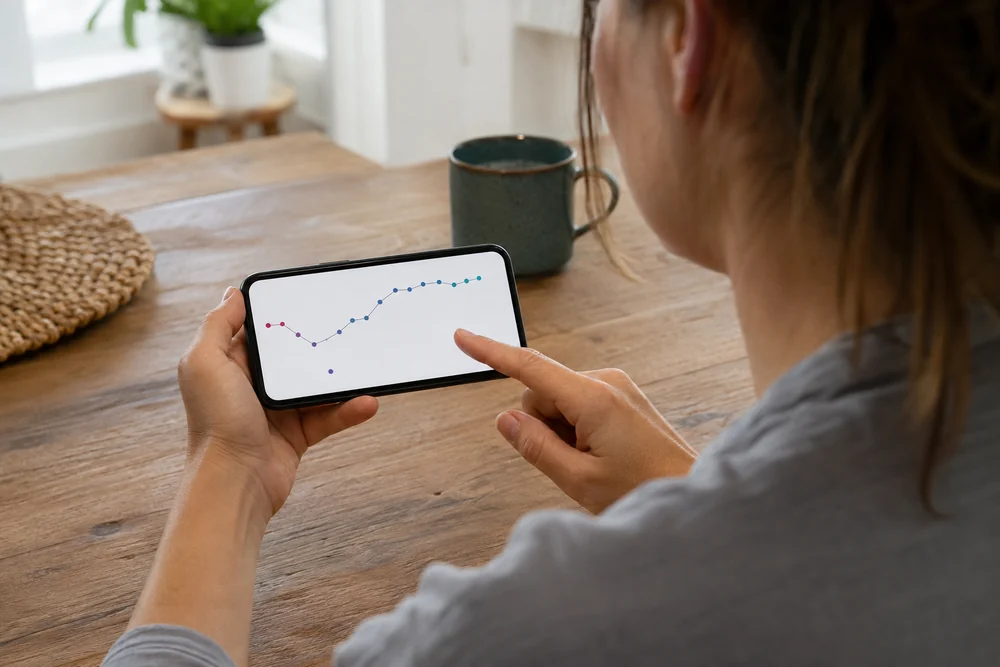
The annotator draws a coverline over your last six low readings, marks the first day three readings sit above it, and flags disturbed readings you have noted.
The full data tableEvery row this tool reads from.
What makes a temperature chart readable
The conditions this annotator checks before it will interpret a chart, and what each one does to the reading. A chart that fails these is not a bad chart; it means the rise cannot be located reliably.
| Condition | What the annotator looks for | Effect on interpretation |
|---|---|---|
| Plausible temperature range | Readings between 34 and 42 degrees Celsius | Values outside this are treated as entry errors and excluded |
| Sustained rise | At least 0.20 degrees above the baseline median, held across consecutive days | A single high reading is not a shift |
| Same route throughout | Oral, vaginal or rectal kept constant | Changing route mid-chart makes readings non-comparable |
| Same thermometer | One device for the whole chart | Device change introduces an offset that can mimic a shift |
| Consistent measurement time | Taken at a similar time after rest each day | Later readings run higher and can create a false shift |
| Sleep quality recorded | Poor or interrupted sleep flagged | Disturbed nights are excluded from the baseline |
| Illness or fever flagged | Marked on the day | Fever days are excluded rather than averaged in |
| Alcohol flagged | Marked on the day | Can raise a reading independently of ovulation |
| Enough baseline days | Several pre-shift readings before the rise | Too few days and no reliable baseline median exists |
A temperature shift is retrospective. It can suggest ovulation has already happened; it cannot predict it, confirm an egg was released, or time intercourse for the current cycle. Charts are read alongside cycle length, LH results and mucus observations rather than on their own. Thyroid conditions, shift work, travel across time zones and some medicines all affect readings.
The full referenceEverything this tool draws on, in detail.Show the detail
An auditable chart, not a black-box verdict
See the sequence, disturbances and calculation together
The chart plots the temperatures you entered, marks readings that may be less comparable and shows exactly how the optional pattern check was applied. It does not use one temperature to diagnose ovulation or pregnancy.
Quick answers
What this chart can show, and what it cannot
What counts as a sustained rise here?
Three consecutive included readings at least 0.20°C above the median of the preceding six included readings.
Does a rise prove ovulation?
No. The pattern may support a retrospective estimate, but the rule is not a diagnostic test.
Should disturbed readings be deleted?
No. Keep them visible and mark or exclude them so the chart retains the complete record.
Can one dip show implantation?
No. A single dip cannot identify implantation and should not be used as a pregnancy test.
How to use the result
Interpret the chart as a record, not a diagnosis
Why relative change matters more than one “normal” temperature
Baseline temperatures differ between people and cycles. The useful information is the sequence relative to that chart’s own baseline. Similar wake times, one thermometer and one measurement route improve comparability, while sleep, illness, alcohol, travel, stress and shift work can move individual readings.
What the optional rule adds
The tool compares six consecutive included baseline readings with the next three consecutive included readings. Each of the final three must be at least 0.20°C above the baseline median. The rule is published so the result can be reproduced, challenged and cited. It is not a validated clinical or contraception algorithm.
What to do with a messy chart
Keep unusual readings visible, record the reason and exclude them from the optional check only when appropriate. Do not fill missing days with invented temperatures. Repeated unclear charts, irregular cycles or fertility concerns are better reviewed with a GP, fertility clinic or trained fertility-awareness educator.
Connected fertility tools
Continue from a BBT pattern to the right next tool
Each tool owns one task. Use only the step that matches the information available in the current cycle.
Related evidence and next steps
Use the page that owns the next cycle question
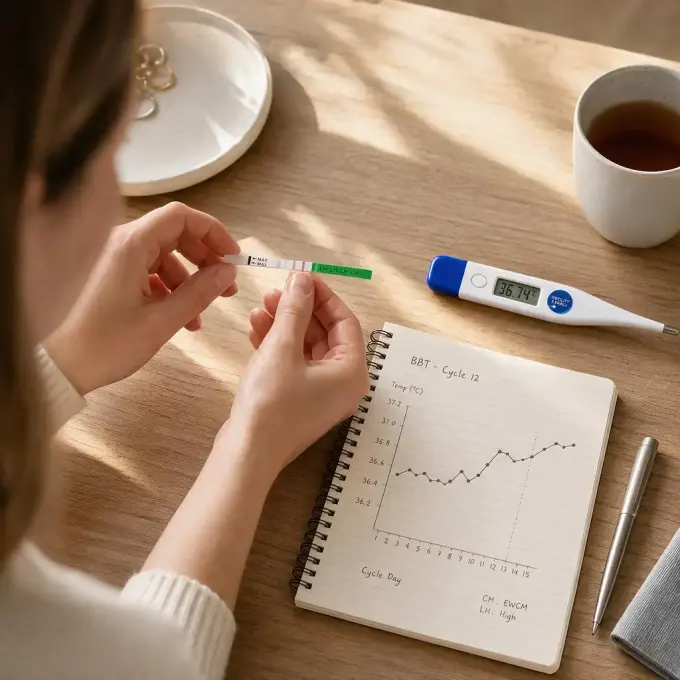
Complete BBT charting guide
Learn how waking temperature fits with other fertility signs and cycle tracking.
Read Complete BBT charting guide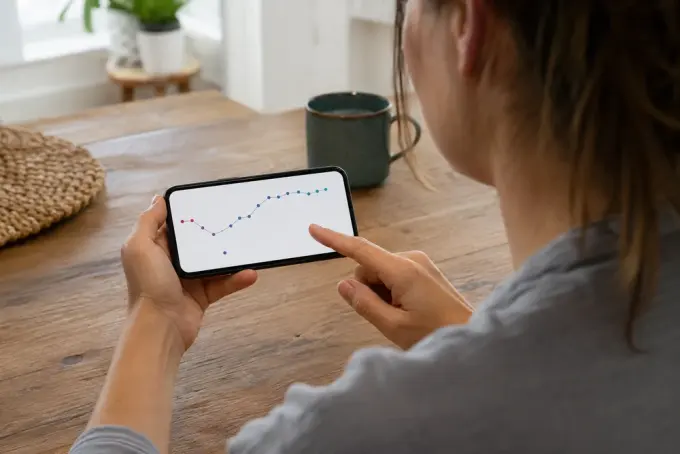
What an implantation dip can and cannot show
Separate one temperature dip from proof of implantation.
Read What an implantation dip can and cannot show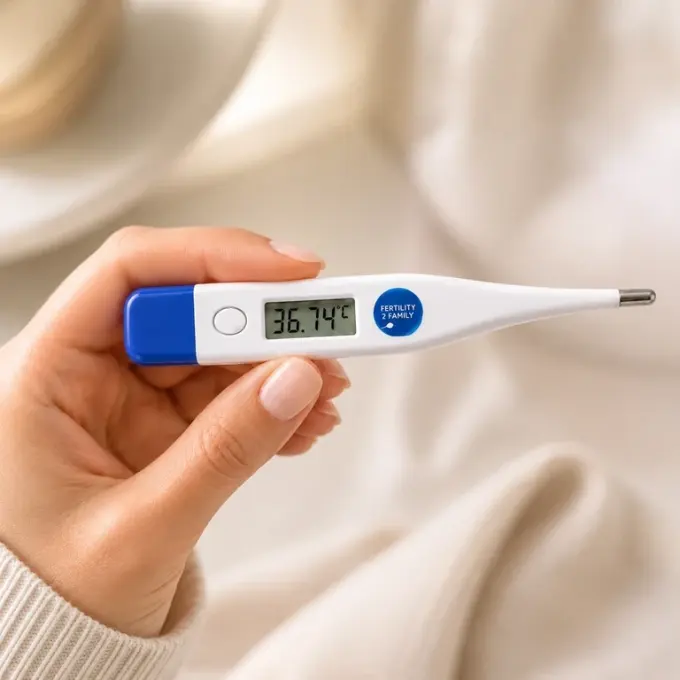
Basal thermometer Australia
Compare a reusable two-decimal BBT thermometer and current product instructions.
Compare basal thermometersAustralian evidence and resources
These sources provide general Australian or product context. They do not replace advice from a qualified clinician.
- Fertility awareness and natural family planning
Healthdirect Australia The limits of cycle, temperature and cervical-mucus observations, including disturbance factors.
- Lactational amenorrhoea
Healthdirect Australia Why absent bleeding alone cannot establish contraception or ovulation status.
Frequently asked questions
- What thermometer do I need?
- A basal thermometer reading to two decimal places. A standard fever thermometer is not precise enough.
- What is an implantation dip?
- A one-day drop around 7 to 10 DPO. It appears in cycles with and without pregnancy, so it means little.
- Can BBT tell me when to have sex?
- Not usefully; the rise appears after ovulation. Pair BBT with LH tests for timing.
- What if my temperatures are all over the place?
- Note waking time, alcohol and illness. If it stays erratic after two cycles, discuss with your GP.

Australian evidence and resourcesShow sources
This is an educational timing aid, not a diagnosis.
Sources: Healthdirect Australia · Jean Hailes for Women's Health · Fertility2Family
What a basal temperature shift can and cannot confirm.healthdirect.gov.au ↗
Progesterone and the post-ovulation temperature rise.healthdirect.gov.au ↗
Cycle phases and typical luteal length.jeanhailes.org.au ↗
Measurement routine and precision.PDF ↗
Pairing LH tests with a temperature chart.PDF ↗